There are thousands of actions that go on during a rugby game. Only a few of them actually matter for the final score. But, as fans, it’s in our nature to try and consume as many variables as we can.
With my first real analysis build, I wanted to strip away what doesn’t matter and focus on a stat anyone can wrap their head around. Carries. And, with Super Rugby Aotearoa starting over the weekend I was eager to put my first tool to work:
An interactive way to track runs in real time
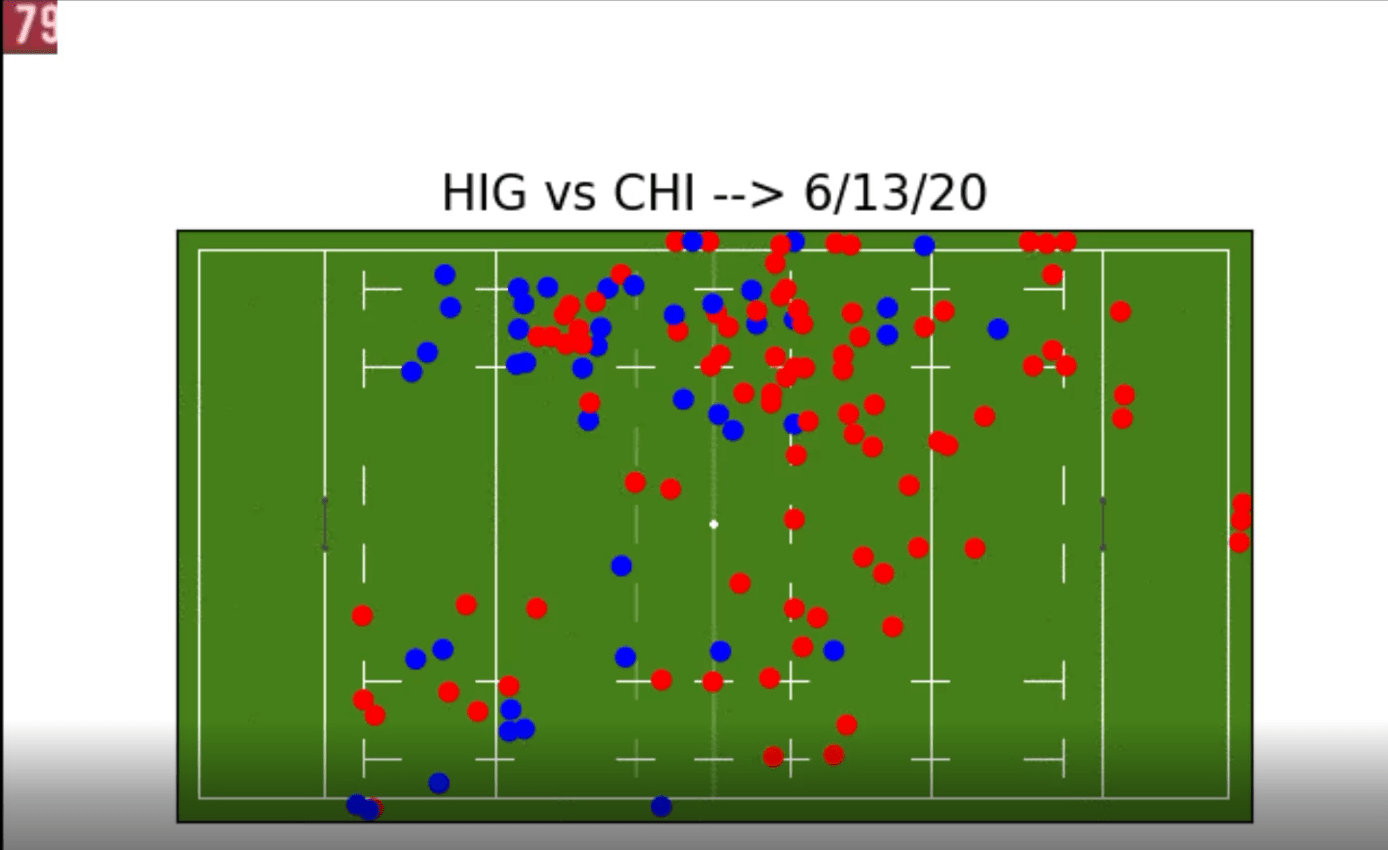
Watch this gif of the Highlanders win over Chiefs from the weekend:
But first…a quick how-to on reading the chart
a. Top Left: The game clock will disappear at times but it is 100% accurate
b. Blue Dots: Any attack starts, not necessarily a full phase (pens, kicks, etc.)
c. Red Dots: Continuation of the same attack
d. Scoring: In the in goal area = Try // Beyond the end line = 3 points
Using this, admittedly closer to when you actually watch the game, you’re able to mentally fill in the context around what you’re seeing and “download” everything that happened in a few minutes
In the coming weeks, I’m going to expand on this with a few ideas in mind of how I can make it better. If you have feedback or want to learn more about how it’s built reach out. My contact info’s on the home page.
The biggest door that this opens, for me in particular, is that we have an easy way to collect positional data and get X,Y coordinates for field events. With this, though it won’t be 100% accurate, the door opens to build more advanced metrics around space, attacking patterns, strategy, and many more previously inaccessible parts of the game.
Thanks for reading!
